We Melburnians can think of little else but the weather at the moment as we are enduring a hot spell of four consecutive days with temperatures over 40 degrees. But then again, we’re always a bit weather-obsessed, as our temperatures often fluctuate wildly. In summer, over two or three days we build up to a hot (usually mid-low thirties) day, then have a cool change that plunges us back to 20 degrees before gradually building up to the mid-thirties again.
Now, as many of you will know, I am very fond of my newspaper. A friend asked me recently “what makes you get out of bed?” and my answer then and now is “getting the paper”. I am distraught when it’s late: going out every five minutes, checking under all the plants in my increasingly bushy cottage garden, checking again…and again…and again. Even when I already know most of what appears in it through the internet or BBC World Radio overnight, I still like opening up new pages and reading the paper cover to cover. It takes hours on the weekend (and yes, I am very tempted by Morry’s Schwartz’s forthcoming Saturday Paper as well)!
When I settle down every morning to read the paper, I always read the death notices. I always read the Odd Spot. And I always read the weather pages. I look at the international weather reports and I mentally transport myself to each of the places I’ve been and try to imagine them under the current weather conditions. I look at Kenya because my boy’s there, where there is either “increasing sunshine” or “showers”; I look at Paris and think of myself sitting on a bench at Versailles; I look at London and think of myself standing opposite the Tower of London; I look at New York and think of Central Park; I look at Toronto and think of the streetcar running past our college at the University; I look at Wellington and think of standing at the harbourside; I look at Christchurch and I grieve for its cathedral in the city square. I have all these pictures in my mind like a series of mental postcards and I riffle through them in my imagination, superimposing that day’s weather report onto them.
Then there are those weather graphs for our own weather in Melbourne for that day. Every day I sigh and say “I don’t GET this graph”. I know that they’re working on probabilities and scales. I’m certain that there’s some mathematical and scientific rationale to this display that my very unmathematical brain cannot understand, and has no interest in trying to do (so explaining it to me in words of one syllable probably won’t help.)
Here’s one for a pleasant summer’s day, (Saturday Jan 11) with little variation between the minimum and maximum.
GRAPH 1 SATURDAY JAN 11
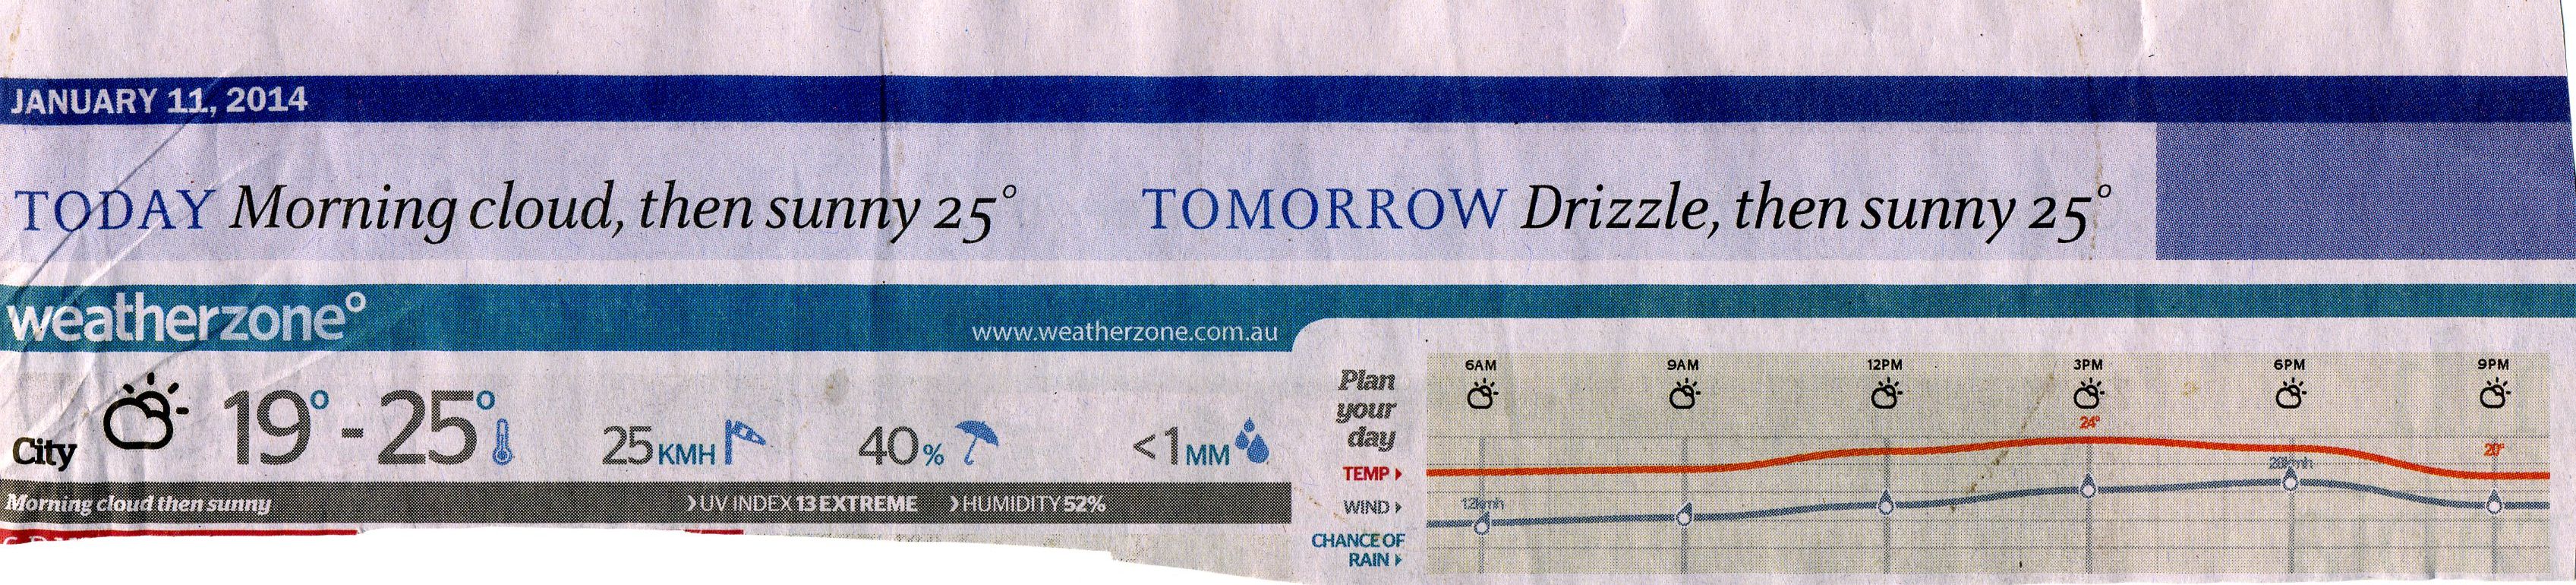
My first problem is that even though the prediction shows 19 – 25, the graph shows a high of 24 (the highest part of the graph) and a low of 20. In every graphic, every day, the temperatures shown never match what is predicted on the left hand side of the page.
GRAPH 2 MONDAY JANUARY 13
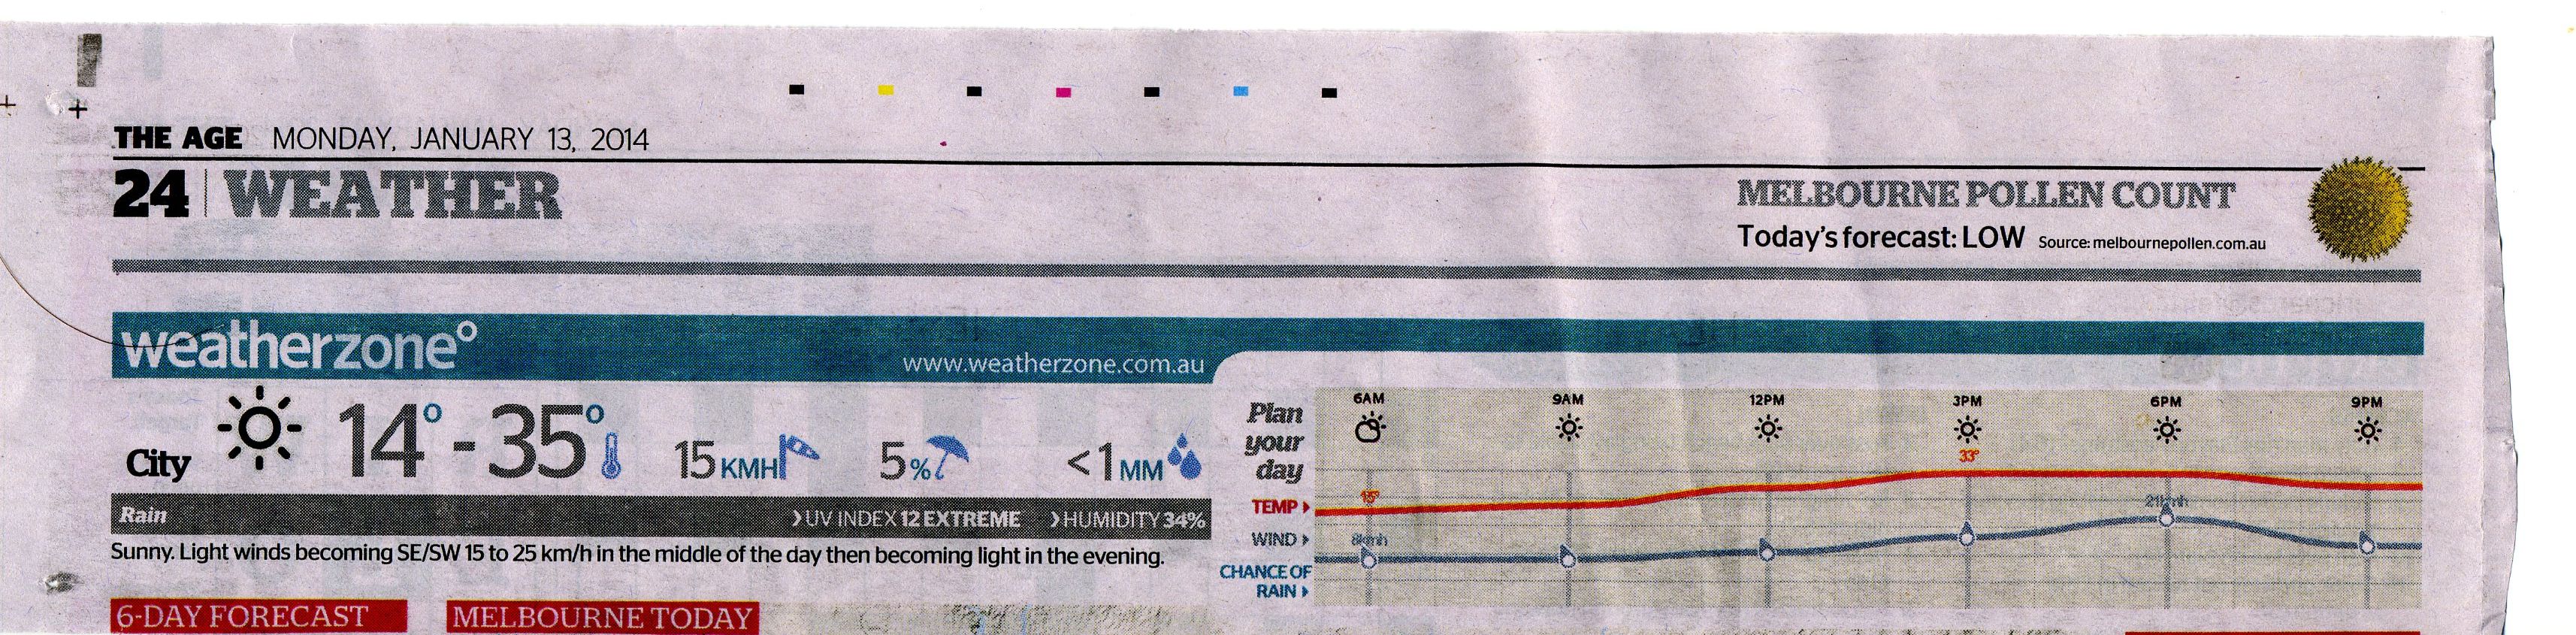
But here we are on Monday Jan 13 where the temperature more than doubles- from 14 to 35 degrees (or as the graph depicts, from 15 to 33). Here’s my second problem- wouldn’t you think that this graph with a vast range between minimum and maximum would look very different from the day where the temperature barely moves?
And here we are for today (Friday Jan 17) , when there’s a sharp cool change predicted tonight (alleluia!)
GRAPH 3 FRIDAY JANUARY 17
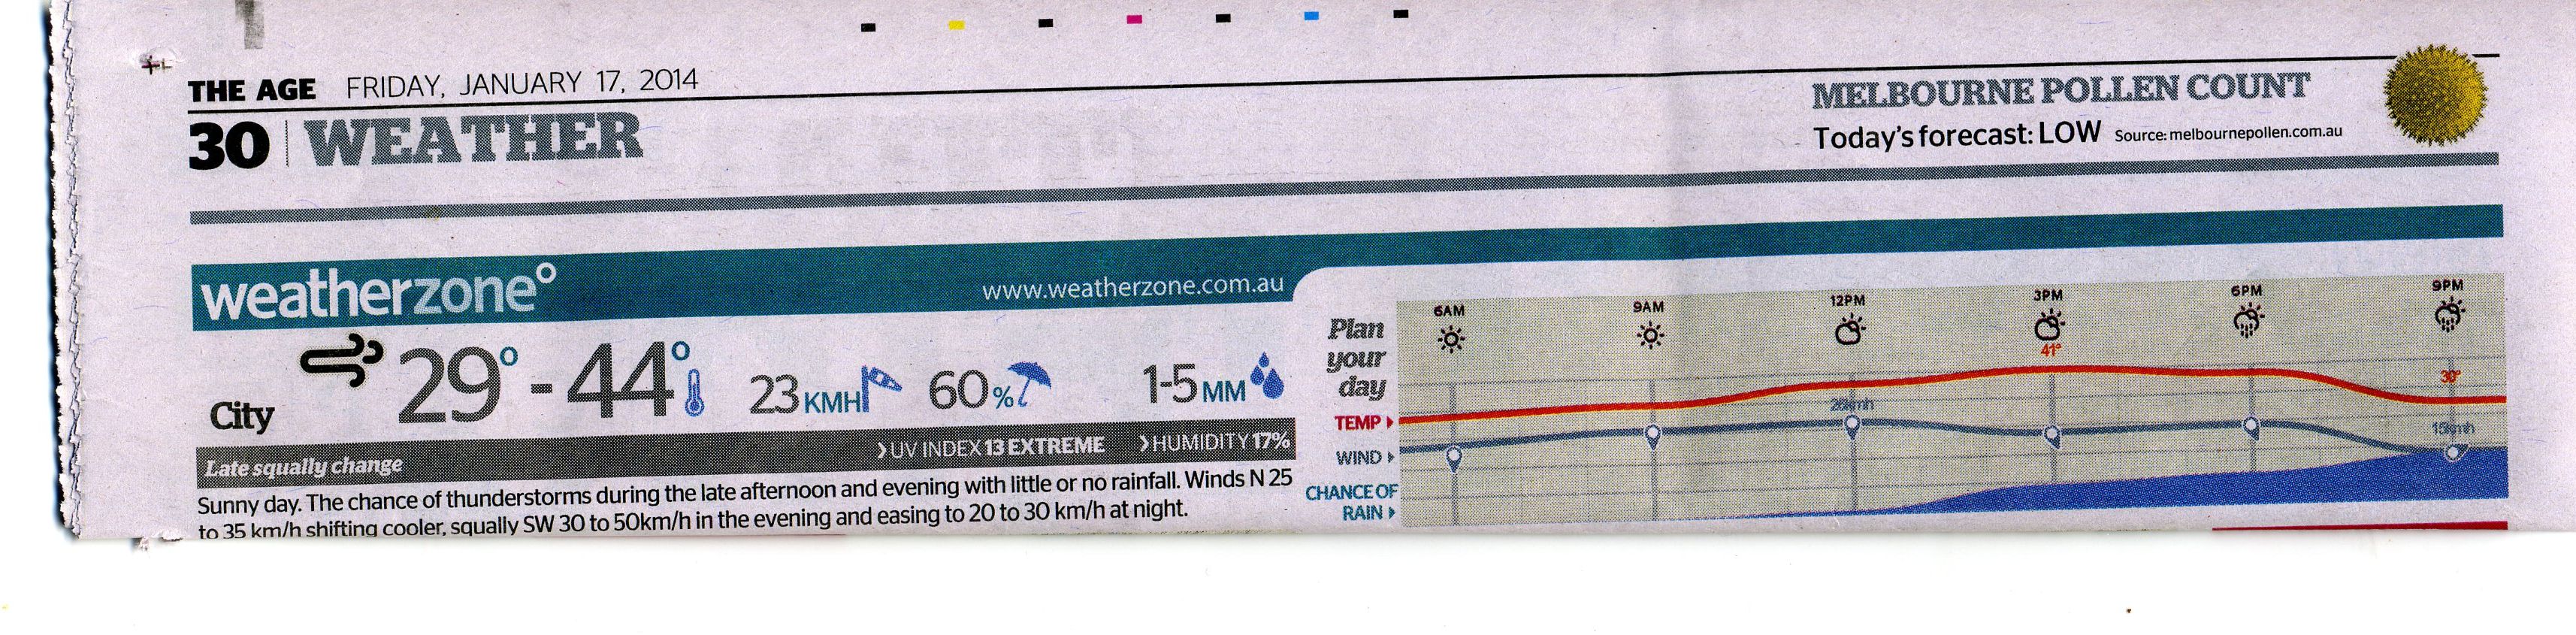
To be sure, it does show a dip between 6.oo p.m. and 9.00 p.m. but it doesn’t reflect the prediction that the temperature will fall 10 degrees within an hour. It shows a high of 41 at 3.00 pm but doesn’t indicate when it’s going to go even higher to reach 44 (and believe me, once you’re over 40, the single degrees DO matter!)
Moreover, the rain predictions confuse me. Here’s a graph from Tuesday 14th where the temperature almost doubled (which is not immediately obvious) with rain forecast in the evening with a 70% likelihood of between 10-20 mm.
GRAPH 4 TUESDAY JANUARY 14
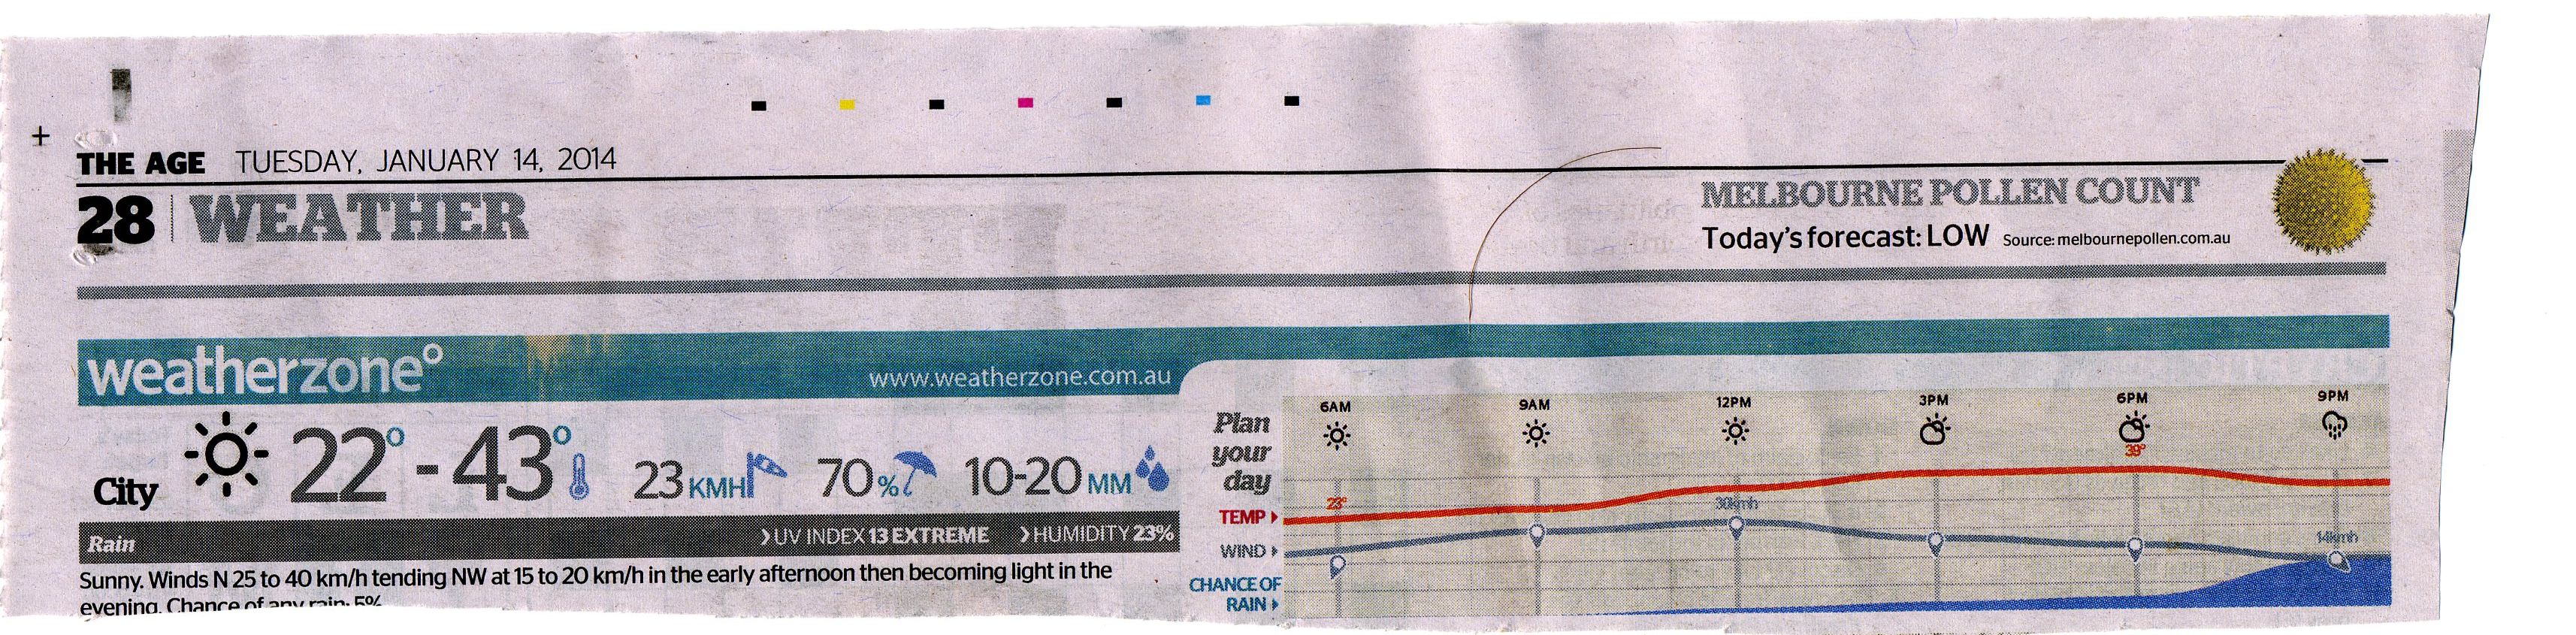
Yet if you compare the appearance of the rain prediction for the January 14th graph with today’s ( Graph 3 January 17th), it looks as if we’re due to get more rain today, yet it’s a 60% likelihood of between 1-5 mm. If it’s only 1 mm, then it barely counts.
While I do appreciate information about the predicted time of a cool change (so that you know whether to take a cardi or not), I am bemused, confused and amused by these graphs every single morning. Gives me something to get out of bed and grumble about every day.
P.S. I wrote about the last heatwave in 2009 here, with a backward glance toward early-Melbourne commentaries on the weather.

Oh Janine, you are funny. Have just read this out to R with much amusement. Written by a woman who looks like she’s giot way too much time on her hands :).
Anything to avoid THE THESIS!! (not really)